INVESTMENTS THAT TRANSFORM
CREIT Portfolio
Home /
DISCOVER CREIT
A Path to Wealth Creation
Our CREIT portfolio includes real estate, infrastructure and credit assets in our Qualified Communities.
CREIT Portfolio Snapshot:
Total Investments
Sept 2019
Portfolio metrics as of March 31, 2025.
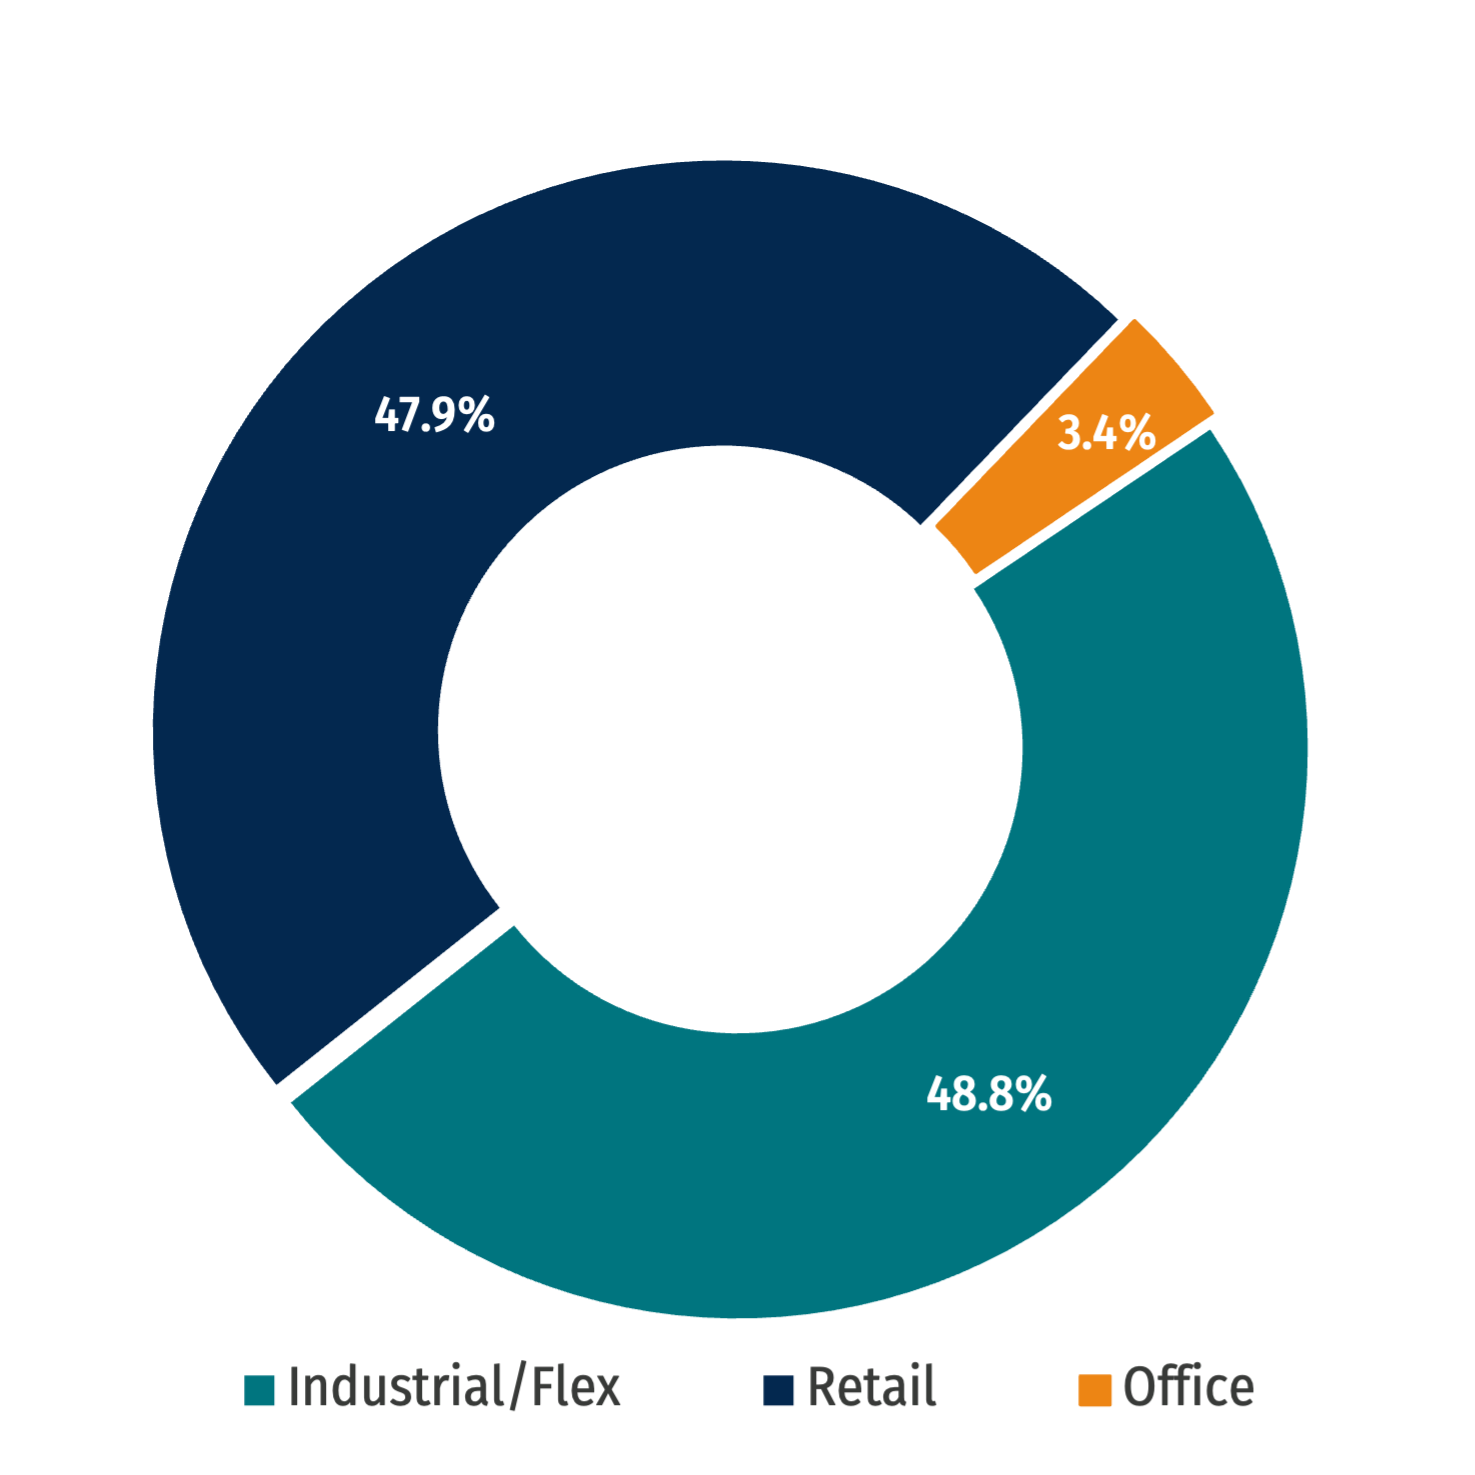
Total Base Rent by Multi-Sector Exposure4
As of March 31, 2025

Total Annualized Base Rent by Credit Mix4
As of March 31, 2025

CREIT Portfolio Concentration5
As of March 31, 2025.
52.8% West
33.3% Southwest
12.0% Midwest
2.0% Southeast
0% Northeast
Weighted Average Lease Term
Portfolio metrics as of March 31, 2025.
Featured Investments

224 Logistics Park
Milwaukie, OR
| Sector | Industrial |
| Sq. Ft (thousands) | 829,087 |
| Acquisition Date | November 2024 |

Goodyear Tires
Victorville, CA
| Sector | Industrial |
| Sq. Ft (thousands) | 829,013 |
| Acquisition Date | June 2023 |

Houston Produce
Houston, TX
| Sector | Industrial |
| Sq. Ft (thousands) | 431,982 |
| Acquisition Date | July 2023 |
PROPERTY ACQUISITIONS
Start your investment journey.
Invest with us, we do the rest.
Our team takes a disciplined approach to sourcing opportunities, leveraging our extensive industry relationships with various clients, owners, developers, and advisors to identify, secure, and maximize transactions that fuel your investment potential.
Invest Now
Contact our team today. We’d be happy to answer any questions!
Important Footnotes + Disclosures
- Gross Asset Value (“GAV”) reflects CREIT’s total assets on balance sheet.
- Net Asset Value (“NAV”) reflects GAV less liabilities, equivalent to CREIT's total members’ equity on balance sheet.
- Inception date for interests in CREIT is September 1, 2019.
- Percentages may not total 100% due to rounding.
- Percentages in chart representing Total Base Rent by Geography and Credit Mix may not total 100% due to rounding.
- Weighted average cap rate reflects underwritten Forward 12 Month Net Operating Income divided by total property carry values.